Usage
The Usage tab is like an itemized phone bill for your credits — it shows every AI operation that cost you something, who triggered it, and when. At a glance you get your current balance, your active credit bundles, and a detailed log of every charge.
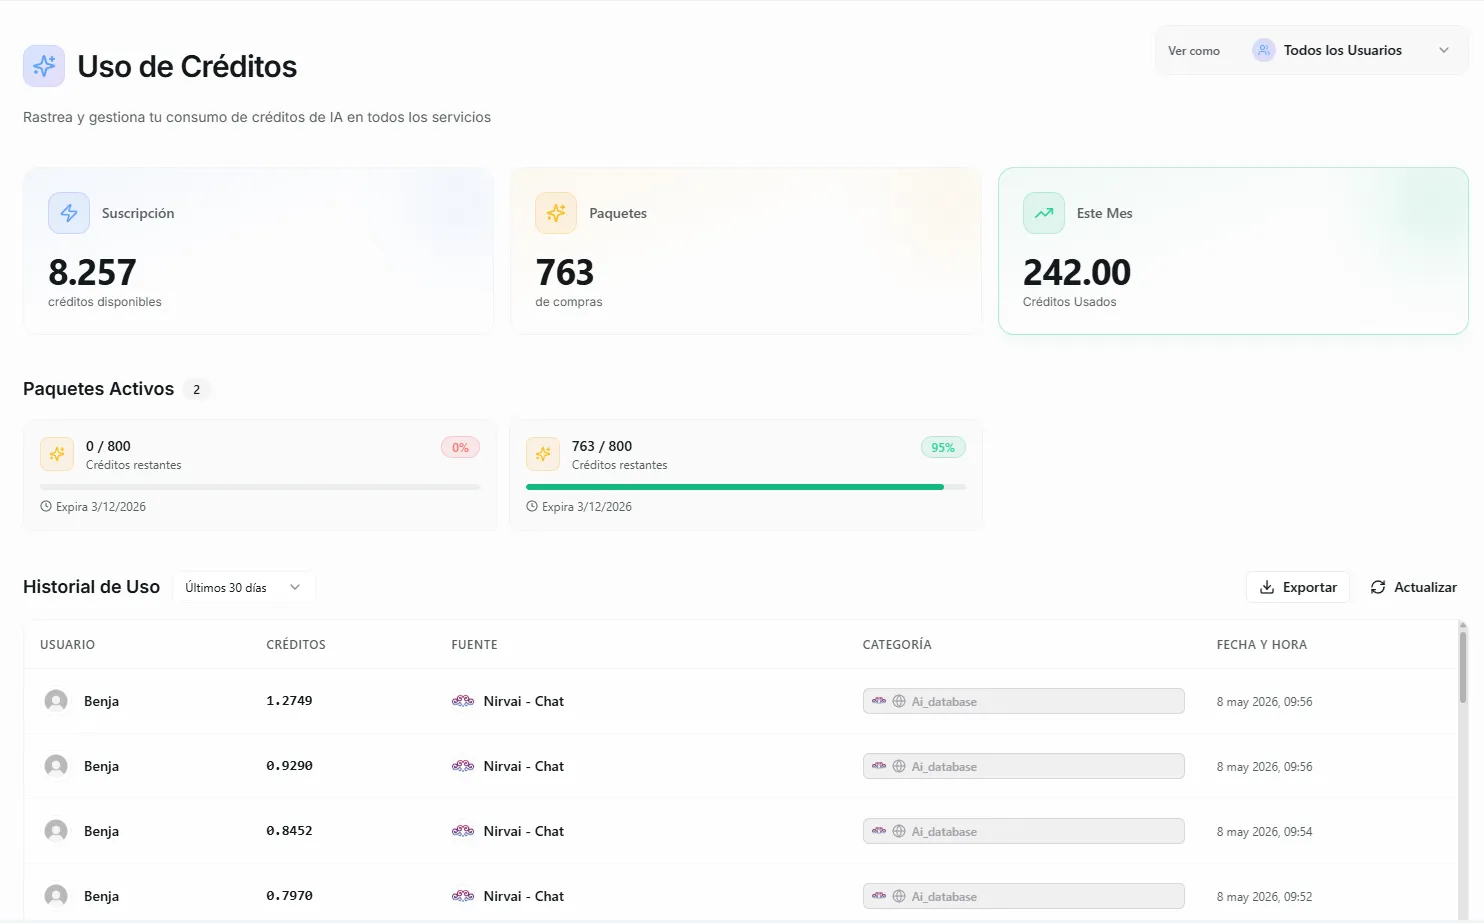 Image: The Usage tab showing credit balance cards and the usage history table
Credit Balance Cards
At the top of the page, three cards show your current credit status at a glance:
| Card | What It Shows |
|---|---|
| Subscription | How many subscription credits are still available this billing cycle |
| Bundles | Total remaining credits across all purchased bundles |
| This Month | Total credits consumed so far this month |
These numbers update in real time as credits are consumed.
 Image: The three credit balance cards showing subscription, bundle, and monthly usage
Active Bundles
If you or your admin have purchased credit bundles, they appear below the balance cards. Each bundle shows:
- Credits remaining out of the total purchased (e.g., "1,200 / 2,000")
- A progress bar — green when above 50%, amber when between 20–50%, red when below 20%
- Expiration date — when the bundle expires
Bundles are consumed in order of expiration — the one expiring soonest gets used first.
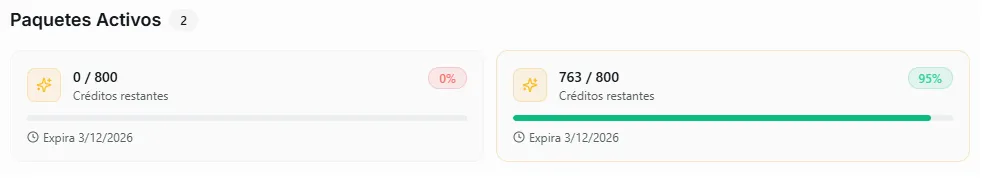 Image: Active credit bundles with progress bars and expiration dates
Usage History
The main table shows a detailed log of every credit-consuming operation. Each row represents a single AI interaction.
Table Columns
| Column | Description |
|---|---|
| User | The team member whose action triggered the credit usage |
| Credits | How many credits were consumed (shown to 4 decimal places) |
| Source | Which agent processed the request. If the agent was triggered by an automation, the workflow name is also shown |
| Category | Where the interaction came from — e.g., Nirvai Chat, WhatsApp, Instagram, Slack, Automation, etc. |
| Timestamp | When the interaction happened, displayed in your configured timezone |
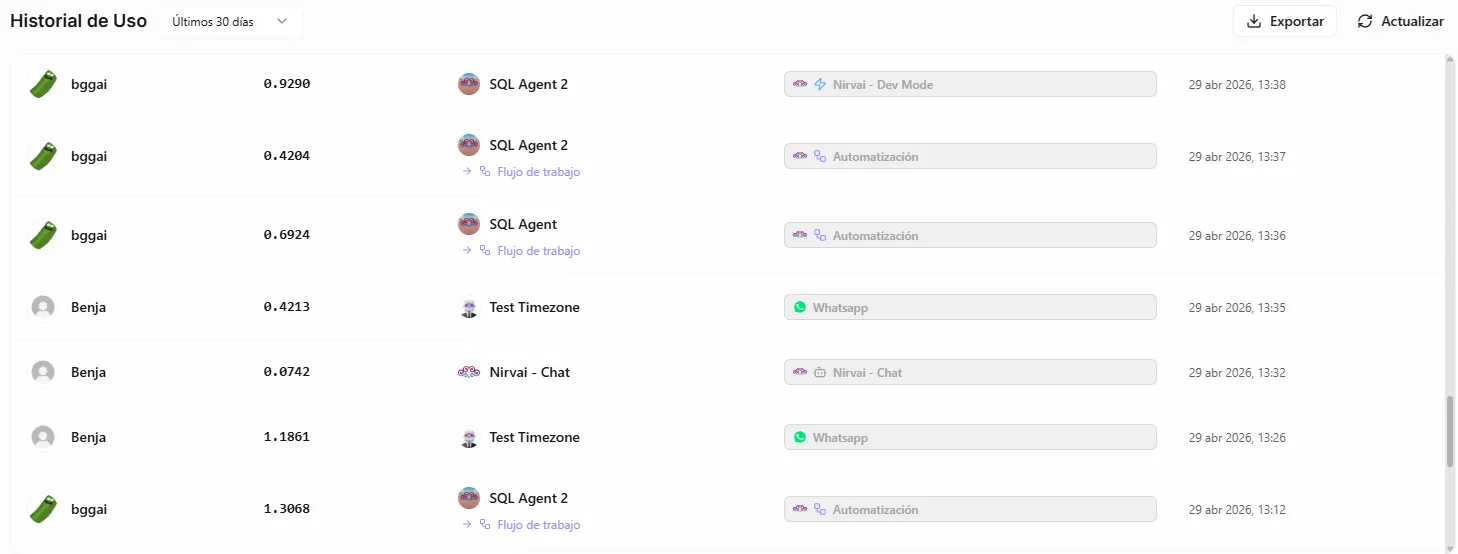 Image: The usage history table showing credit entries with user, source, and category columns
Category Icons
Each category in the table has a visual indicator so you can quickly scan what's using your credits:
| Category | Description |
|---|---|
| Nirvai - Chat | The built-in AI chat inside the platform |
| Nirvai - Dev Mode | Developer-mode chat interactions |
| Automation | Steps triggered by an automated workflow |
| WhatsApp, Instagram, Messenger | Messages from customers on those platforms |
| Telegram, Slack, Discord, Teams | Messages from team or community channels |
| Web, Script Tag | Web embed and chatbot widget interactions |
| API | Requests made via the API channel |
Automation Entries
When a credit is consumed during an automation, the table shows extra context:
- The agent name that ran the step
- An arrow (→) followed by the workflow name, so you can trace which automation triggered the cost
Filtering and Date Range
Date Range
Use the dropdown next to "Usage History" to filter by time period:
- Last 7 days
- Last 30 days (default)
- Last 90 days
- Last 6 months
- Last year
Filter by User (Admin Only)
If you're an organization admin, a "View as" dropdown appears at the top-right corner. This lets you:
- All Users — see credit usage across the entire organization
- Specific user — filter to see only one team member's activity
This is helpful when you need to understand which team members or departments are consuming the most credits.
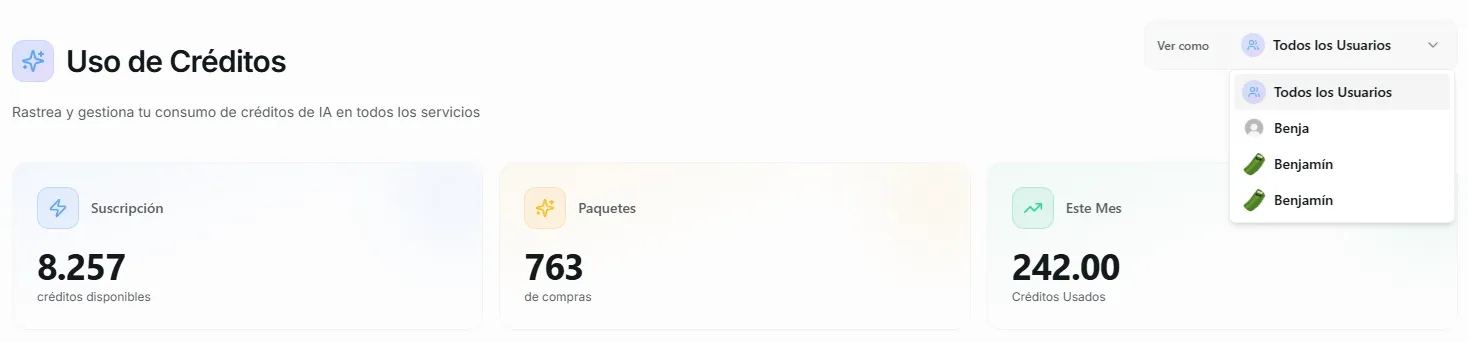 Image: The View as dropdown showing All Users and individual team members
Exporting Data
You can export your usage data as a CSV file for reporting, accounting, or analysis.
How to Export
- Click the Export button in the top-right of the Usage History section
- Choose a time range:
- This month
- Last 30 days
- Last 60 days
- Last 90 days
- A CSV file downloads to your computer
The exported file includes: Date, User, Credits Used, Agent Name, Category, Parent Category, Workflow Name, and Session ID.
Exports respect your current user filter. If you've selected a specific team member in the "View as" dropdown, the CSV will only include that person's data.
Pagination
The table shows 50 entries per page. If you have more than 50 entries in the selected date range, use the Previous and Next buttons at the bottom to navigate between pages. The total count ("Showing 1 to 50 of 237") is displayed alongside the controls.
Common Questions
Why do some entries show very small credit amounts like 0.0012? Different AI operations consume different amounts of credits depending on the complexity of the request. A short response uses fewer credits than a long, multi-step answer. The 4-decimal precision lets you see the exact cost of each interaction.
I see "Nirvai Chat" as the source, but I didn't use the chat. What is it? If no specific agent is associated with the credit usage, it defaults to "Nirvai Chat." This can happen with system-level AI operations or when the chat is used directly.
Can members see other people's usage? Regular members only see their own usage data. Admins can use the "View as" dropdown to see any member's usage or the organization-wide total.
The timestamps seem wrong. How do I fix them? Timestamps are displayed based on your configured timezone. If they look off, go to Settings > Configuration and verify your timezone setting is correct.
Can I get usage data from more than a year ago? The date range filter goes up to one year. If you need historical data beyond that, contact support.
How often is the usage data updated? The data is updated in real time. Each AI operation appears in the table as soon as it completes. You can also click the Refresh button to force a reload.